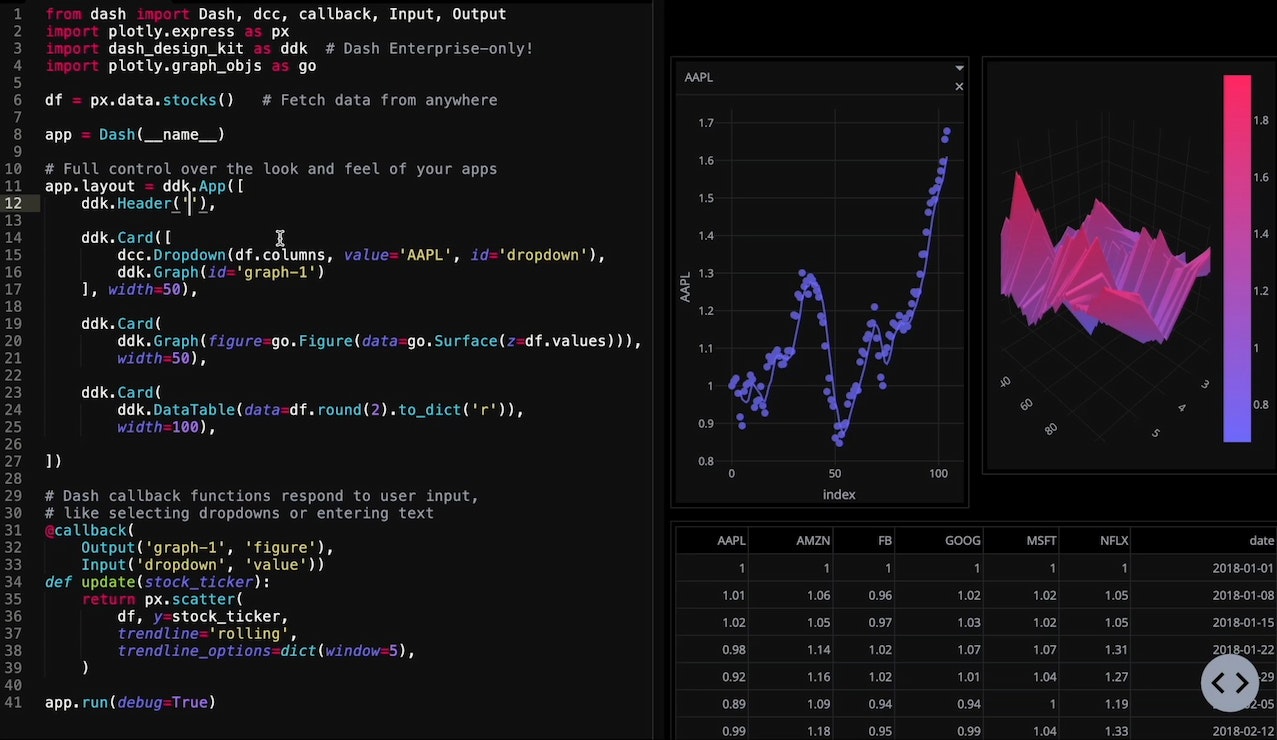
Plotly is an online data visualization tool that enables users to create and collaborate on interactive and publication-quality graphs. It is used by many professionals around the world in industries such as engineering, finance, analytics, and data science. It is also used in academia, government, and the non-profit sector.
Plotly is a software library written in Python and R language. It also has a web-based application programming interface (API) for working with interactive graphs. It allows users to easily transform data into beautiful graphs and charts using its built-in functions.
The software library is open source and can be used to create interactive 3D graphs, charts, and maps. Additionally, Plotly supports over 40 types of graphs and charts including line charts, bar charts, histograms, bubble charts, contour plots, heat maps and more.
In addition to generating and sharing visualizations, Plotly also provides features such as dashboards, collaboration tools, and integration with other data science tools. For example, Plotly can be integrated with Jupyter notebook to create interactive data visualizations in Python. Furthermore, Plotly also supports integration with Tableau, Qlik, Matplotlib, and many other data systems.
Overall, Plotly is a powerful data visualization tool that makes it easy to create and share interactive charts and graphs. It is gaining popularity among professionals for its robust set of features and flexibility. It is an open source software library that is easy to use and understand, making it accessible to researchers, students, and any data enthusiast looking to explore and visualize data.


