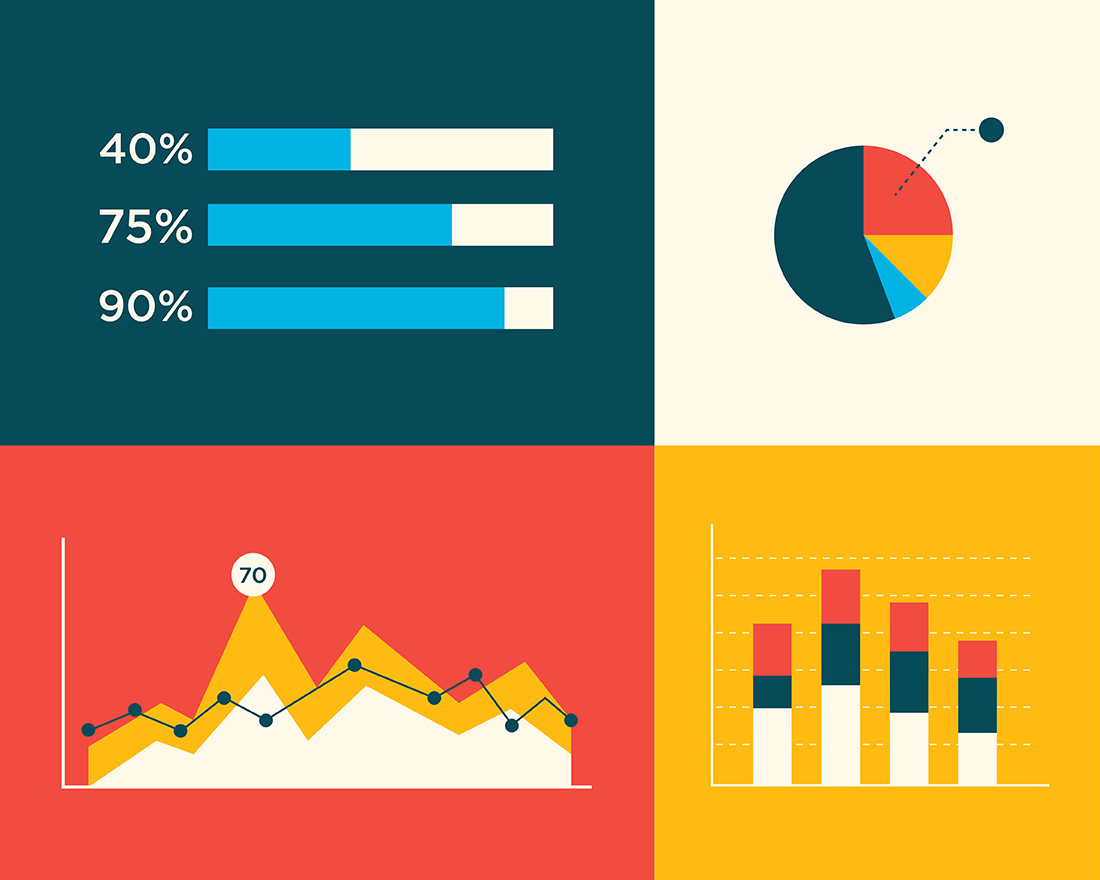
Data visualization is the graphical representation of data in a pictorial or graphical format. It involves the creation of visual elements such as charts, graphs, maps, and diagrams to present data in an understandable way. Data visualization has many applications in a variety of fields, such as medicine, engineering, business, science, finance, marketing, and education.
Data visualization provides insights into complex datasets by highlighting trends, correlations, and other patterns. It also helps organizations make decisions based on meaningful data. By using data visualization tools, decision-makers can quickly and easily understand large amounts of data and recognize major trends. This allows them to act promptly on these insights and make the most optimal decisions. Data visualization also helps reduce confusion by providing a clear visual representation of complex data.
Data visualization can be used to convey quantitative data, qualitative data, and categorical data. Quantitative data are numerical data providing information on a given phenomenon. Qualitative data refer to observations that are descriptive, rather than numerical. Categorical data are data points defined by categories. With the proper visual representation, one can quickly and easily make decisions based on a data set. For example, a line graph can be used to present a timeline or demonstrate the growth of a specific measure over time.
Data visualization is becoming increasingly important as data collection methods become more advanced. With the rise of big data, data visualization has become an invaluable resource for decision makers. By displaying large datasets in a visually appealing and understandable way, organizations can make more accurate decisions quickly and efficiently.
Overall, data visualization is a powerful tool for making sense of complex data sets. By representing data points visually, organizations can better understand the underlying trends and make decisions based on meaningful insights. As the need for data visualization continues to grow, more organizations are utilizing it to make smart and informed business decisions.


