


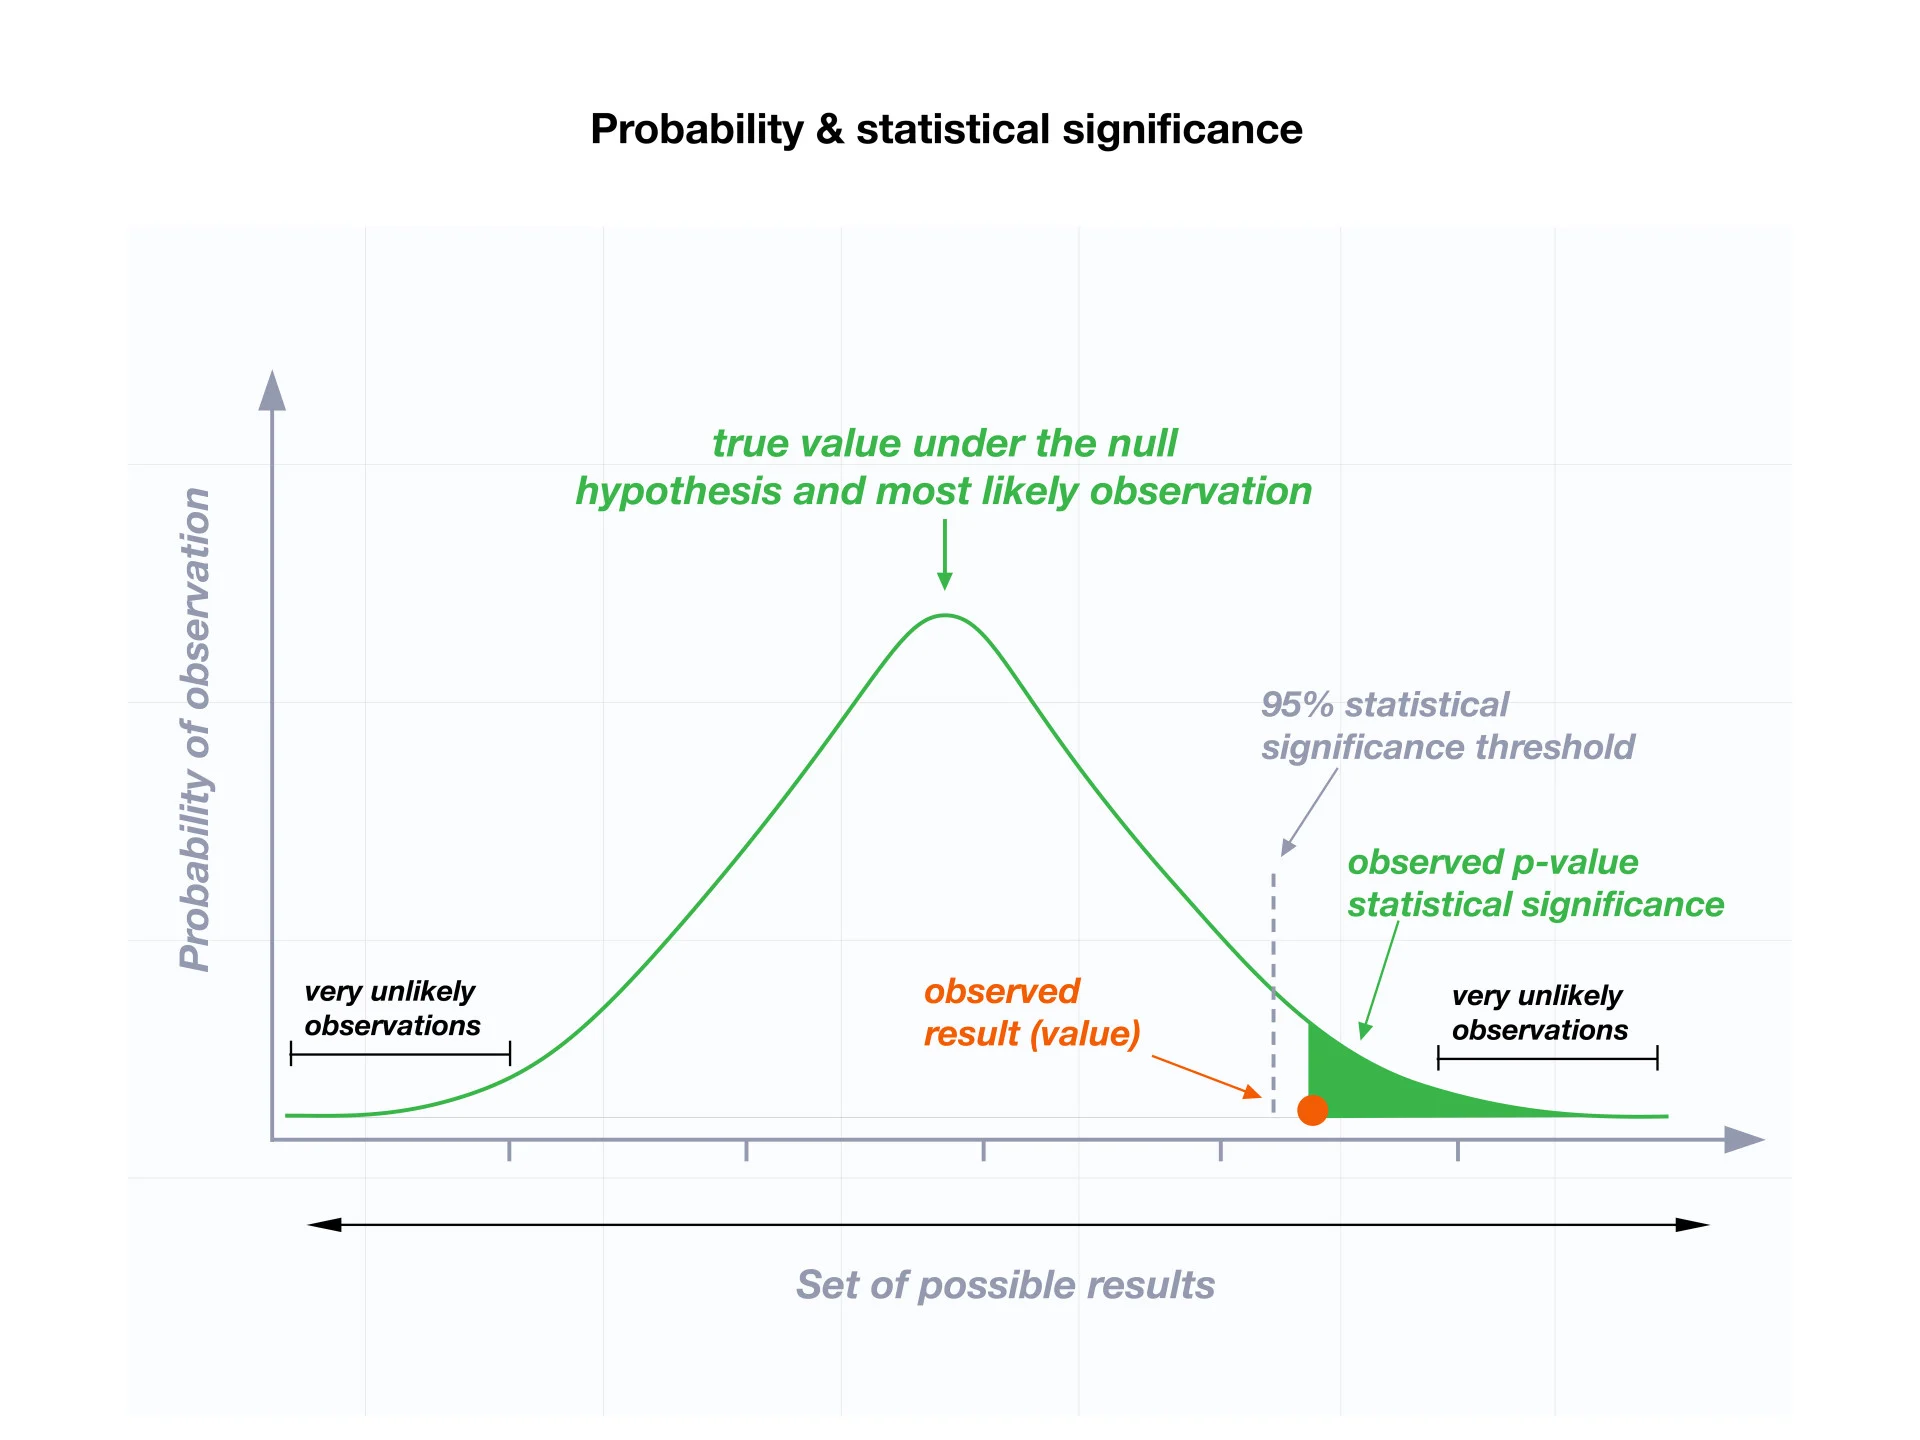
P-value is a statistic used in computer science and other data-driven fields to measure the strength of evidence against a null hypothesis. P-value is the probability of obtaining a result at least as extreme as the observed result, assuming that the null hypothesis is true. It is typically represented as a decimal ranging from 0 to 1, where 0 represents a perfect match to the null hypothesis and 1 represents a perfect mismatch.
A p-value is calculated from the probability distribution under the null hypothesis. It is not the probability that the null hypothesis is true nor the probability of the observed result actually occurring. The smaller the p-value, the more reliable the evidence is that the null hypothesis is false.
Since it is the probability of a result at least as extreme as the observed result, the p-value is computed using statistical tests such as the one-tailed t-test (with directionality) or the two-tailed t-test (without directionality). The t-test is applied to the observed data from a scientific experiment, and the t-value is then converted to the p-value.
It is important to note that the p-value is not a measure of the accuracy of the data but rather a measure of the strength of evidence against the null hypothesis. Therefore, even if the p-value is low (meaning the evidence is strong against the null hypothesis) the data may still be inaccurate.
The p-value is commonly used in hypothesis testing and in data-driven research to determine whether an observed result is statistically significant. In either case, a researcher must evaluate the validity of the analysis and results before making any decisions about accepted values or conclusions.